


Futureproof your real estate using the new CRREM module in the Green Buildings Tool
En route to 2050, property owners, investors, managers and their banks are experiencing increasing pressure from the Paris Agreement and intensifying regulations. At the same time, they face the risk of stranded assets*. In order to monitor these, the Carbon Risk Real Estate Monitor (CRREM) was launched in 2018. Many research institutions and organisations engaged, but getting the right data and mapping the way forward is not as simple as ABC. This article will explain what CRREM is and what (data) is needed to make real estate future-proof.
What is CRREM?
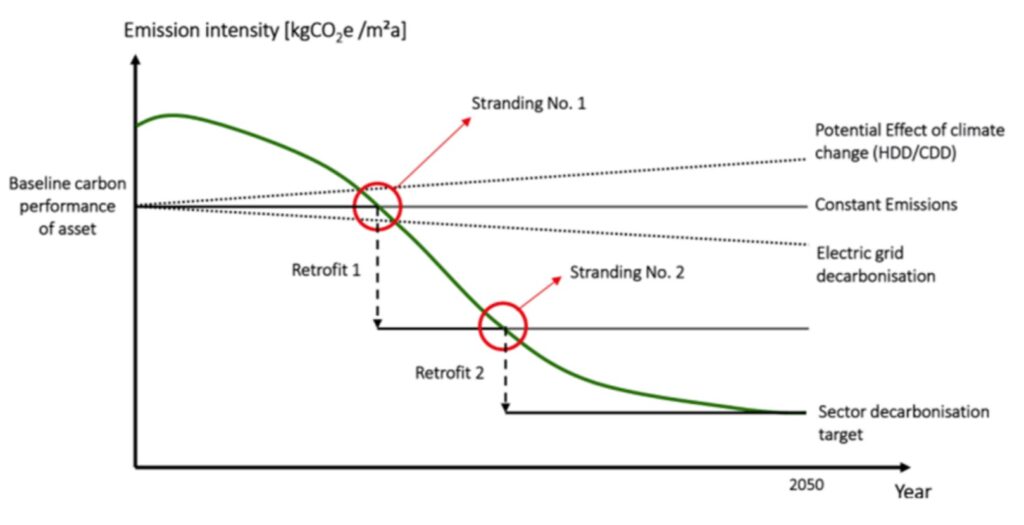
CRREM is an initiative that drives substantial energy savings in buildings to stay within the climate targets of the Paris Climate Agreement. CRREM looks at the energy use and operational CO2 emissions of buildings and portfolios. Pathways have been drawn up for commercial sectors to stay within the 1.5 to 2-degree carbon budget for each country. CO2 emissions and consumption must remain below the decarbonisation pathway line to avoid being labelled as a stranded asset.
The main objective of CRREM is to contribute to increasing energy efficiency investment in the real estate sector by addressing the need to further understand the down-side-risk of climate change on real estate.
CRREM module in the Green Buildings Tool
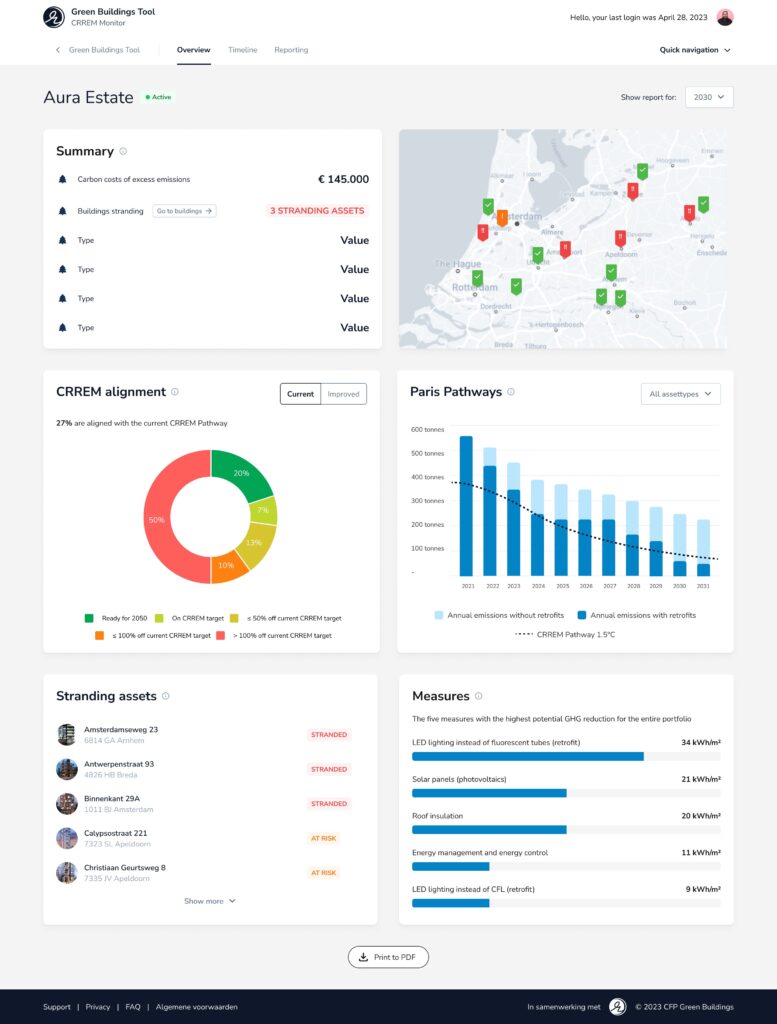
We previously wrote about the impact of sustainable developments on the real estate sector. The continuous tightening of regulatory frameworks for ESG brings ambiguities and requires a considerable time investment. With CRREM being embraced by an increasing number of banks and used in annual reporting, the need for automated reporting for entire portfolios is growing. That’s why we added a CRREM module to our Green Buildings Tool. This module can quickly flag stranded assets at the level of an individual building or indicate the distribution of CRREM alignment across a portfolio.
Gaining insight: current values and improvement
Our CRREM module enables investors to align their real estate portfolios to Paris-compliant-decarbonisation pathways and highlight which assets or portfolios currently fall short of these pathways and 2050 net-zero goals. Not only can it calculate the current CRREM values; but it also provides the potential status of assets considering a selection of retrofitting investments planned over time.
Using the Green Buildings Tool’s timeline feature, users can track the mitigation of greenhouse gas emissions over time and evaluate the progress of investors’ carbon performance. This will further support transparency and communication regarding ESG commitments.
The Carbon intensity metric
The ultimate goal of retrofitting the building stock is reducing carbon emissions. As the emissions heavily depend on the type of fuel consumed, the Carbon intensity metric quantifies the associated emissions of the energy consumption of a building based on the CRREM decarbonisation pathways. Expressed in CO2e/m2/year, it provides a simple and effective way to measure energy efficiency progress and identify improvement opportunities.
The Carbon intensity both displays the current and improved situation, considering the energy reduction from selected measures. To calculate these scores, the tool requires the building’s energy consumption, which the user can provide. However, if this information is not available, the tool uses benchmark values from the 300+ building personas, using the property type, construction year, and building size.
Each country has a distinct way of reducing carbon emissions based on their energy sources. As a result, buildings with similar features will have different emissions targets and carbon intensities across various countries. For instance, France uses a significant amount of nuclear energy, which has a low carbon footprint. Therefore, France has much lower emissions targets than Germany, where a large portion of energy comes from high carbon-intensity fuels like coal.
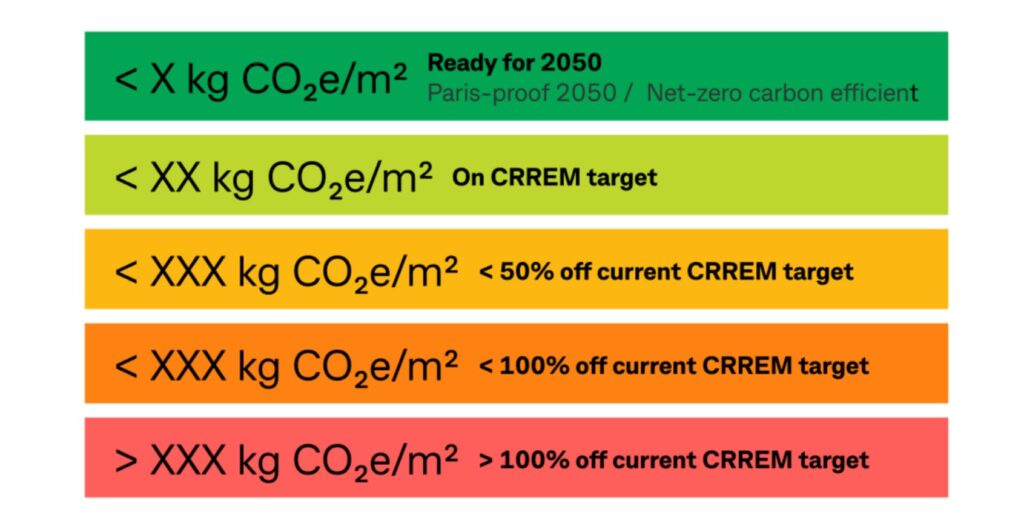
To simplify the comparisons between a building’s performance, the Carbon intensity feature uses the following scale that aligns with the different country commitments and property types based on CRREM:
Using the Carbon intensity metric, the Green Buildings Tool also provides an indication of the asset’s year of stranding, based on the CRREM methodology, considering its planned and completed retrofits. This will allow building owners and investors to work on future-proofing their portfolio, with limited time required, by utilising the power of public and private data.
*A stranded asset is a property that no longer meets future energy efficiency standards and market expectations and thus runs the risk of decreasing value.
Would you like to get started today? We are happy to help! Get in touch or request a demo.