
What are the numbers behind the WELL building standard?

Most people are not that familiar with the WELL building standard and WELL may be a bit vague at first. But there’s a lot more to it than you think. The WELL method turns out not only to be a practical approach to improving health and productivity, but also technically quite challenging. But let’s start by looking at a few figures that show why healthy buildings are important:
- The average person in the Netherlands spends 90% of the day indoors
- In the 1980s, the WHO estimated that about 30% of buildings had a poor indoor climate
- The cost of a poor indoor climate is around €3,600 per employee per year
WELL certification

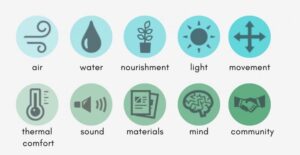
An important part of using the WELL building standard is validating the use. An auditor will only visit the building after completion & handover, so he or she can determine whether the building meets WELL certification credits in the day-to-day practice. The auditor is not involved in the design phase. That means the assessment is not just about technology, but even more than that about policy and implementation. All credits are evidence-based (they are proven to contribute to better health and their actual performance is actually tested) and are divided into 10 categories.
Even though WELL is mainly about compliance with policies, technology does play an important role in earning the credits. Cataloguing and assessing the WELL credits, as well as supervising and implementing the measures requires considerable technical knowledge. For a layman, many credits will be difficult to understand. To give an example:
- A01 Fundamental air quality – Part 4: The radon threshold (radon is a radioactive particle released into the air from building materials)
- The radon level must be below 0.15 Bq/L [4 pCi/L]. The test must be carried out for every 2,300 m2 of usable area, and must be performed by an independent third party.
Comfortable and energy-saving

When building a building, we put most of our energy into keeping the air quality and temperature right, because these two aspects play a very big role in the comfort of those who work inside. This also benefits the health and productivity of employees. Fortunately, for the most part, energy savings and health go well together. For example, low-temperature heating not only saves energy but is also more comfortable. Other examples of energy-saving measures that also contribute to comfort include avoiding heating and cooling at the same time, preventing draughts and using blinds in summer.
Now, the figures:
- A comfortable indoor climate increases productivity by 10-15%;
- Lack of fresh air is a contributing factor in an estimated 35% of sickness absences;
- Properly ventilating a poorly insulated building can increase labour productivity by 29%;
- Individual control over temperature (in a range of 4˚ C) leads to an increase of about 3% in logical thinking performance and 7% in typing speed;
- Office users who sit close to a window sleep an average of 46 minutes longer per night than those who sit further away;
- View and daylight together account for a statistically significant 6.5% of the variation in sick leave;
- At higher background noise levels, there is a direct link between increased adrenaline level and stress;
- A variety of workplace typologies promotes productivity;
- Just looking at nature appears to reduce physical and psychological complaints;
- On average, there are 2-5 times more pollutants in indoor air than in the open air, but in some buildings this may be as much as 100 times.
Do you also want to make your building healthier? Read more about healthy buildings or contact us for tailor-made advice.


